Marketplace Dashboard
The Marketplace Dashboard is a live dashboard that displays your earned Marketplace revenue. You can watch for trends, monitor key stations or shows, and see the revenue you are generating.
In this article we are going to cover:
- Metrics and terms
- Marketplace Dashboard
Metrics and terms
|
Revenue |
Net revenue (after ad revenue share) generated based on the number of impressions delivered, multiplied by the average impressions' eCPM. |
|
Impressions |
The total number of impressions generated by the publisher(s). An impression is generated by a listener being connected to your station or podcast during an ad spot. |
|
eCPM |
Effective cost per mile is the average revenue earned for every 1000 delivered impressions. |
Marketplace Dashboard Overview
The Audio Streaming Marketplace Dashboard provides customers who have opted into the Marketplace with a high-level look into the revenue generated.
To log in, access https://audiostreaming-monetise.arqiva.com/ and use your account credentials. After logging in, you will be redirected to the Monetise dashboard. To access the Marketplace dashboard you would have to select Marketplace from the left-side navigation menu.
You also have the option to refine the data by specifying a date range, selecting a specific publisher, or filtering by individual publisher.

Statistics Summary
The dashboard presents a high-level summary including:
1. Total Revenue (net of fees and revenue share)
2. Total Impressions
3. Average eCPM (Effective Cost Per Mille)
These metrics are displayed for selected publishers and can be filtered for deeper analysis.

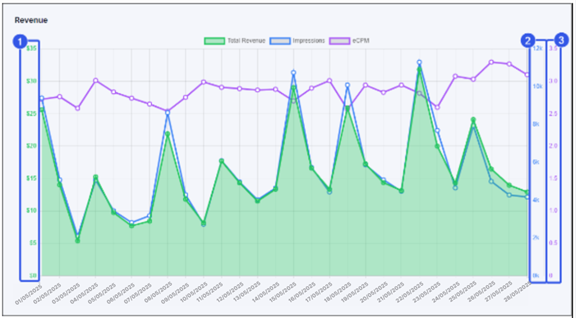
Revenue Graph
A line graph visualises revenue trends over time:
- Green: Total Revenue
- Blue: Total Impressions
- Purple: Average eCPM
This graph helps identify performance patterns and assess campaign effectiveness.
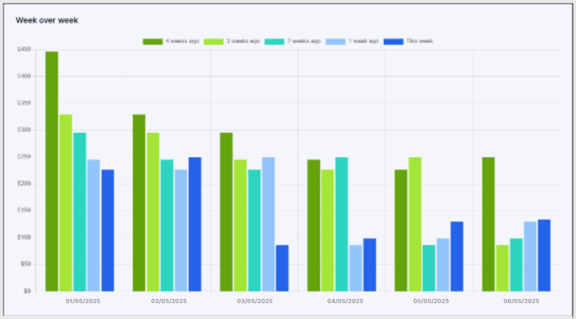
Weekly Performance Breakdown
The final graph provides a weekly breakdown of performance over the past month, based on your selected filters. This view supports strategic planning and optimisation of monetisation efforts.