
Podcast Analytics
The Podcast Analytics service provides comprehensive insights, reporting, and audience measurements for podcasts distributed via Audio Streaming. This managed solution ensures expert support, reduced operational overhead, and scalable analytics capabilities.
This guide covers the following components of the Podcast Analytics service:
- Overview
- Downloads
The Podcast Analytics dashboard has two tabs: ‘Overview’ and ‘Downloads’. You can easily switch between these tabs by clicking on one of the tabs near the top-left of the screen. We'll cover the ‘Overview’ tab first, followed by a walkthrough of the ‘Downloads’ tab.
Overview
The ‘Overview’ section allows you to break down and display visualisations of your host statistics using graphs and charts.
There are four types of filtering: by time interval (1), shows (2), published time (3), and episodes (4).
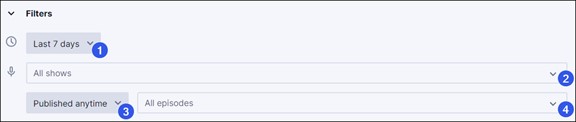
To begin using these filters, select a time interval for the analytics displayed on the ‘Overview’ page by picking from the predefined date ranges. You can also set a custom time interval as you desire. Then, you can narrow your analytics results by starting to type the name of the show and episode. When filtering episodes by published date, you can examine analytics for episodes that were published within a particular time frame. As you set the filters, you'll observe that the ‘Overview’ page updates to reflect the filtered analytics.
Here you will find a note displaying the user's time zone. This is just to remind you which time zone is used for all reports in Insights.
The time zone can be changed by clicking on the user's profile at the top-right corner of any screen.
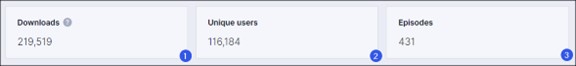
Moving down to the ‘Overview’ page, the following section presents a high-level summary of your statistics by the total number of downloads for selected episodes (1), the number of unique users that accessed the selected episodes (2), and the number of episodes in the selected show (3). Again, these statistics represent the filters you set above.
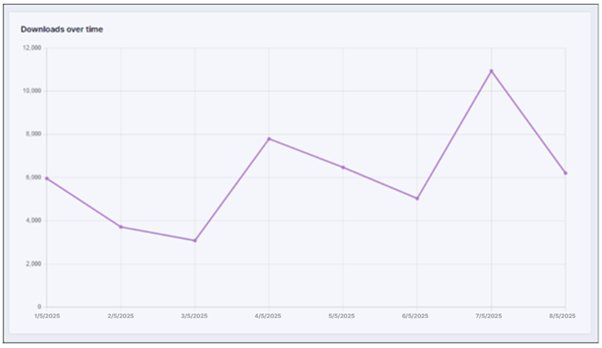
Below the summary information, you will find a line graph with data about downloads over time based on the range selected. The time dimension is distributed on the horizontal axis, while the vertical axis reports values of unique downloads. The graph below shows what an example 7-day filter would look like.
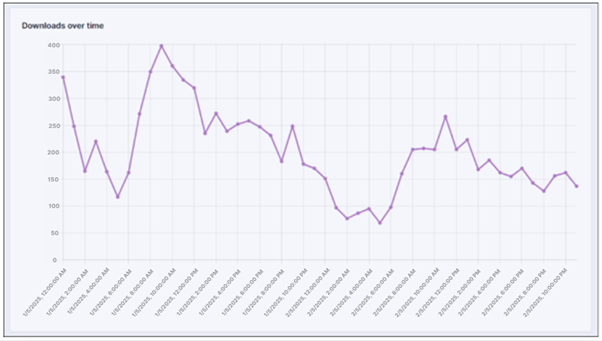
If the filter range selected is lower than three days, the granularity of the horizontal axis changes to hours. This graph shows what a 2-day filter might look like, with the downloads per hour represented.
The last section of the ‘Overview’ page presents more detailed statistics through four pie graphs which further break down statistics according to the filters you originally set at the top. These graphs show the total downloads by different dimensions: by show (1), by episode (2), by country (3), by platform (4), and by city (5).
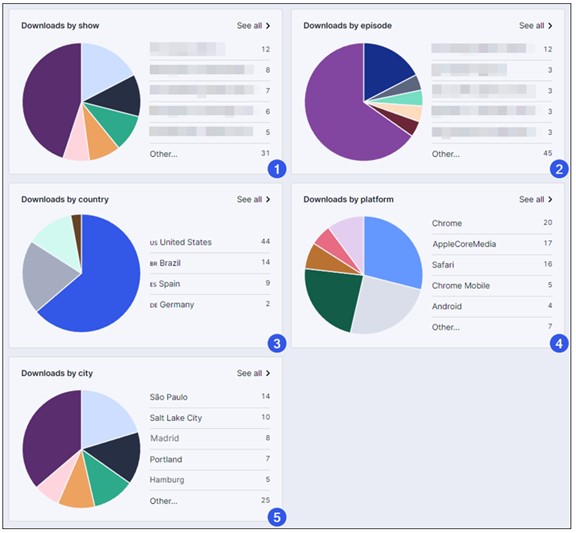
There is a ‘See all’ link at the top-right of each pie graph which will redirect you to the ‘Downloads’ tab.
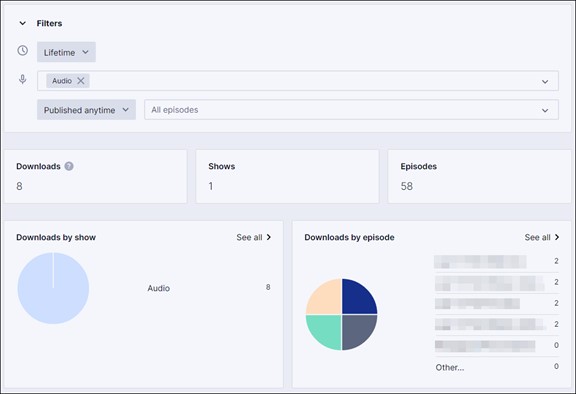
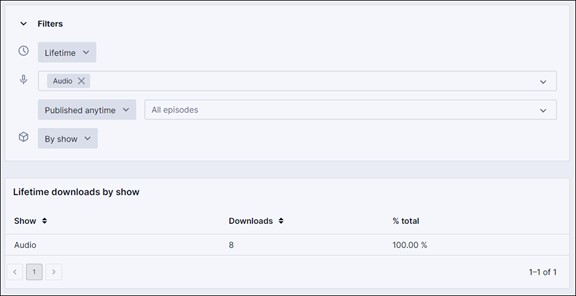
By selecting the ‘Lifetime’ filter, we provide lifetime download statistics, so you don't have to remember or configure the start date of the Audio Streaming service. You can also apply additional filters for Show, Episode, and Published date as you wish. The last section presents the number of downloads by show and episode through two pie graphs, based on the filters you set.
The lifetime download statistics only include data from Audio Streaming, as we do not count downloads from previous hosting providers.
Stats for lifetime period are updated daily around midnight UTC. Downloads counted since then aren't included until the next processing.
Downloads
In the ‘Download’ tab, we provide you with one more filter to help you to explore the download details of your podcast(s), as well as the ability to export these details in a CSV file.
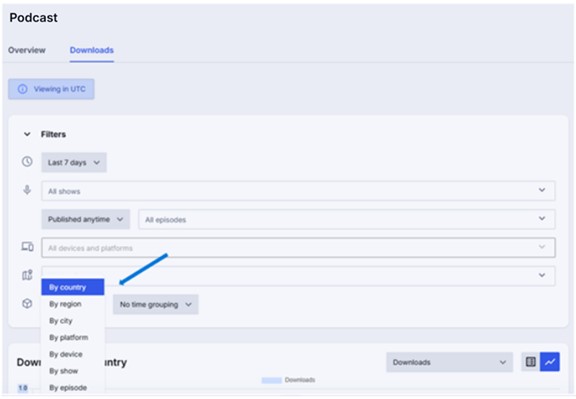
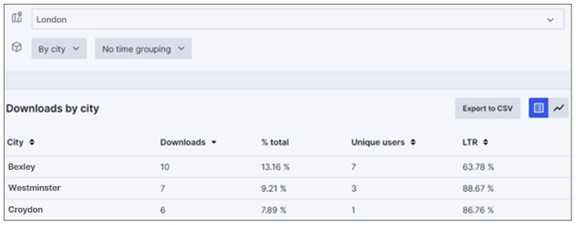
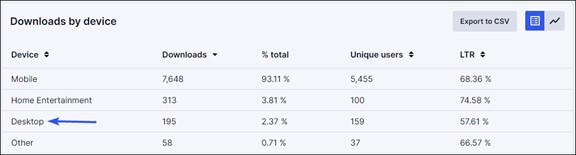
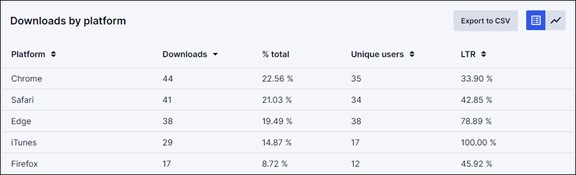
The default dimension used for filtering on the Download page is "By show". This can easily be changed to "By region", "By city", "By platform", "By device", "By country", and "By episode" using the drop-down menu.
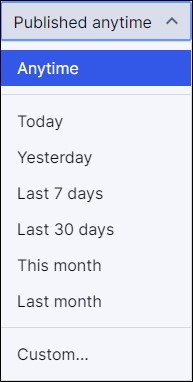
You can apply filtering by Published date. This can be changed to "Today", "Yesterday", "Last 7 days", "Last 30 days", "This month", "Last month" or choose a "Custom" time frame using the drop-down menu.
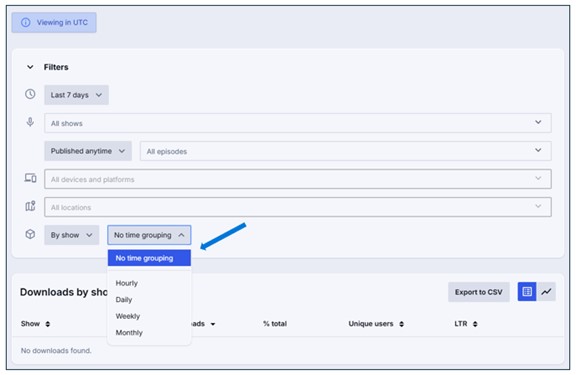
Additionally, we provide you with one more filter named Time grouping. As such, you could filter analytics "Hourly", "Daily", "Weekly", or "Monthly".
As mentioned in the ‘Overview’, we have the note displaying the user's time zone used for all the filters. This can be changed from the user's profile located in the top right corner of the screen.
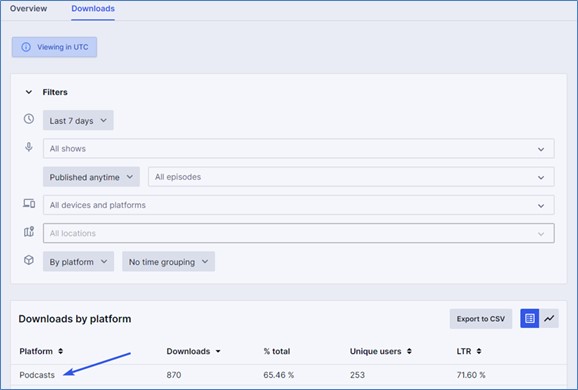
You can easily identify traffic coming from Podcasts by Selecting "By Platform."
Once you've set a filter, the results can be ordered by ascending or descending using the default table view.
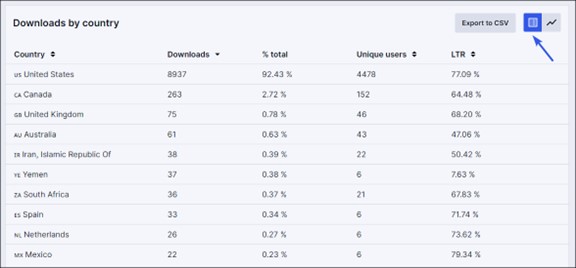
Clicking on a specific country name will result in a breakdown of that country's regions.
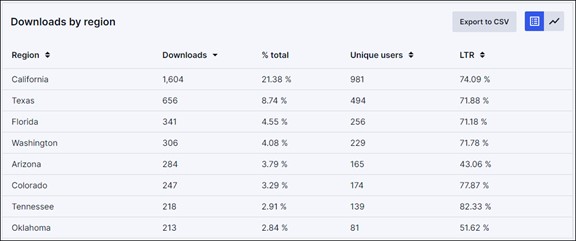
Clicking on a region name will result in a breakdown table of downloads by city in that region.
You can also filter by location, using the type-to-search feature.
Currently, the location filter can only be set to a value at once.
If Device dimension is selected, you can drill down to platform by clicking on a device name.
Clicking on a specific show will present a breakdown by episodes. You can easily switch to the bar graph view in order to see the same results in a different format.
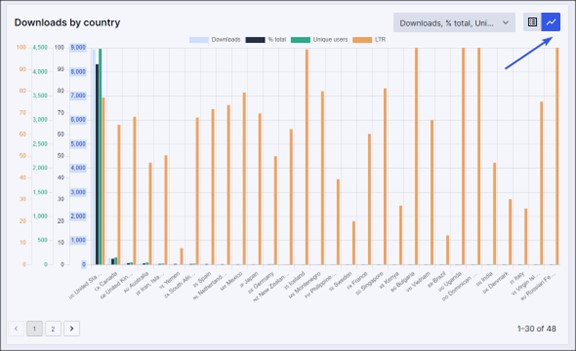
When switching to the bar graph view for the downloads dimensions, you are able to select each metric individually. However, you must always have at least one metric selected.

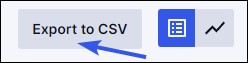
If you would like to download your results, this option is available by clicking on the "Export to CSV" button. This will download a CSV file with your data which can be imported into another tool of your choice.
Filters will be automatically added by the system to the name of the CSV file.
Show and Episode names are automatically synchronised every twelve hours from Host. Before they are synchronised, you may see the Show ID or Episode ID appear in reporting.
Show names and episode names are synced at 03:00 and 15:00 GMT
Show Admins sync at 04:00 and 16:00 GMT
If you select the Lifetime filter, you will be able to view lifetime downloads for shows or episodes. The default sorting is descending.
If you have any further questions or concerns please do not hesitate to contact our Support Team through by emailing us at audiostreaming@arqiva.com