
Audience Analytics
The Audience Analytics dashboard provides comprehensive insights into your audience engagement across two key services: Streaming and Podcasting. This guide outlines how to access and interpret the data, with a focus on maximising the benefits of our fully managed analytics platform.
Accessing the Dashboard
To begin, follow these steps:
- Navigate to the Analytics page
- Log in using your assigned account credentials.
- Upon successful login, you will be directed to the ‘Overview’ page.
Dashboard Overview
The ‘Overview’ page is divided into six key sections, each offering targeted insights to support data-driven decisions. Refer to the visual layout below for orientation:
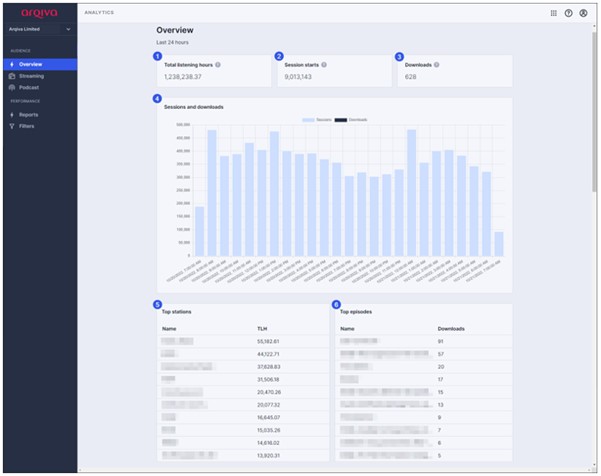
Section 1: Total Listening Hours (Streaming Only)
Displays the Total Listening Hours (TLH), calculated by summing the duration of all sessions active for at least one minute within the selected date range. Providing a clear understanding of overall audience engagement over time.
Section 2: Active Sessions (Streaming Only)
Shows the number of sessions that were connected for at least one second. This helps you track real-time listener activity and identify peak usage periods.
Section 3: Episode Downloads (Podcast Only)
Reports the total number of unique episode downloads, including both full and partial downloads, in compliance with IAB v2.0 standards. This enables accurate measurement of podcast reach and content popularity.
Section 4: 24-Hour Activity Graph
Visualises the number of sessions and downloads over the past 24 hours. Allowing you to monitor short-term trends and assess the impact of recent content releases.
Section 5: Top Stations by TLH (Streaming Only)
Highlights your top-performing stations based on Total Listening Hours. Helping you identify high-performing content and optimise programming strategies.
Section 6: Top Episodes by Downloads (Podcast Only)
Displays the most downloaded podcast episodes. Giving you an understanding of listener preferences and tailor future content accordingly.